The first experimental results regard testing a single Mott polarimeter. The method of Mott polarimetry has been used for decades but in 2POL we have to measure asymmetry of Møller electrons forming a divergent beam (however limited by acceptance of collimators). The main aim of testing a single polarimeter is to obtain information about the signal asymmetry and background relation in one leg. The primary 3n MeV beam, delivered by the accelerator, is polarised in the vertical direction with spin-up and spin-down alternating every second.
A quantity called in physics asymmetry is defined as follows. Let U and D denote two variables. Asymmetry, A, is given by:
A= (U-D)/(U+D).
Presently our test setup consists of one Mott polarimeter mounted in the left Møller leg and a scintillation counter mounted in the right Møller leg, named CH3. This counter records all events occuring on the Be target and their amplitude spectrum is shown in the figure below.
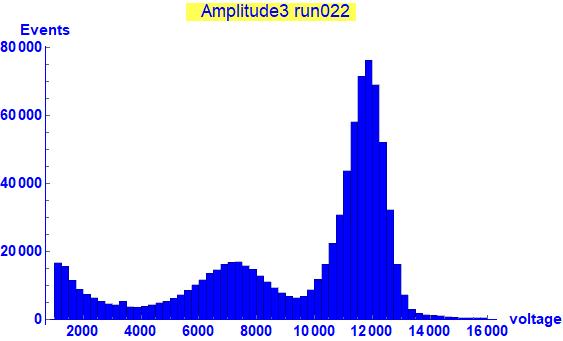
The highest peak corresponds to the beam electrons deflected on Be nuclei (Mott scattering on Be) and going into the right leg; its position on the axis can be used for energy calibration (3 MeV). The lower cusp is due to the quasi symmetric Møller electrons entering the right leg (about 1.5 MeV). The rise towards the low channel numbers corresponds to the background only. All structures overlap due to a finite resolution of the scintillation counter. The purpose of this direct measurement was to determine the spectrum of electrons entering the Mott polarimeters.
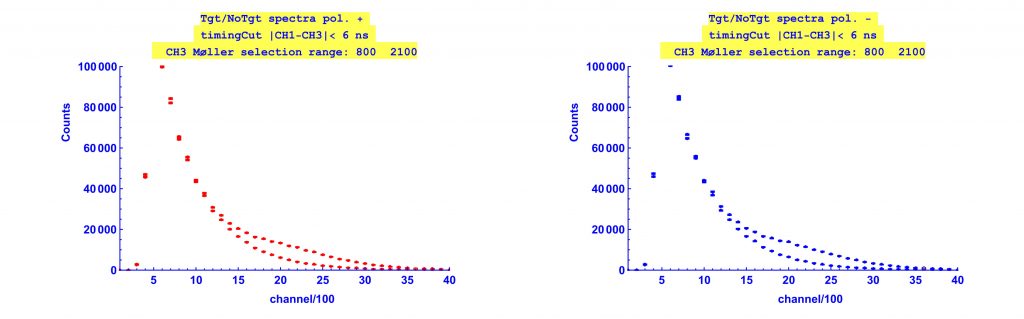
Now the left leg. It is equipped with the Mott polarimeter, consisting of two scintillation counters. There are different ways to measure polarisation using Mott scattering. One of the ways is to measure asymmetry in one counter using a beam with alternating polarisations in equal proportions. Consider one of these counters, named CH1. The plots below show the amplitude (energy) spectrum in this counter: left – for spin-up configuration (red) and right – for spin-down configuration (blue). On each of these two figures there are data points for runs with and without the Au target (taken for the same time duration): the former show the visible cusps over the latter, which appear owing to the presence of the target and these correspond to the Møller electrons. This effect is so pronounced because of imposed conditions: the CH3 signal amplitudes have to fall within the Møller cusp (figure above) as well as the time difference between the CH1 and CH3 signals in a given event must be less than 6 ns (coincidence).
What one can obviously do for each of these figures is to subtract the spectra with target and without target in order to obtain spectra for events originating from the target only. The result is shown in the following figure where red and blue points indicate the spin cnofiguration as above.
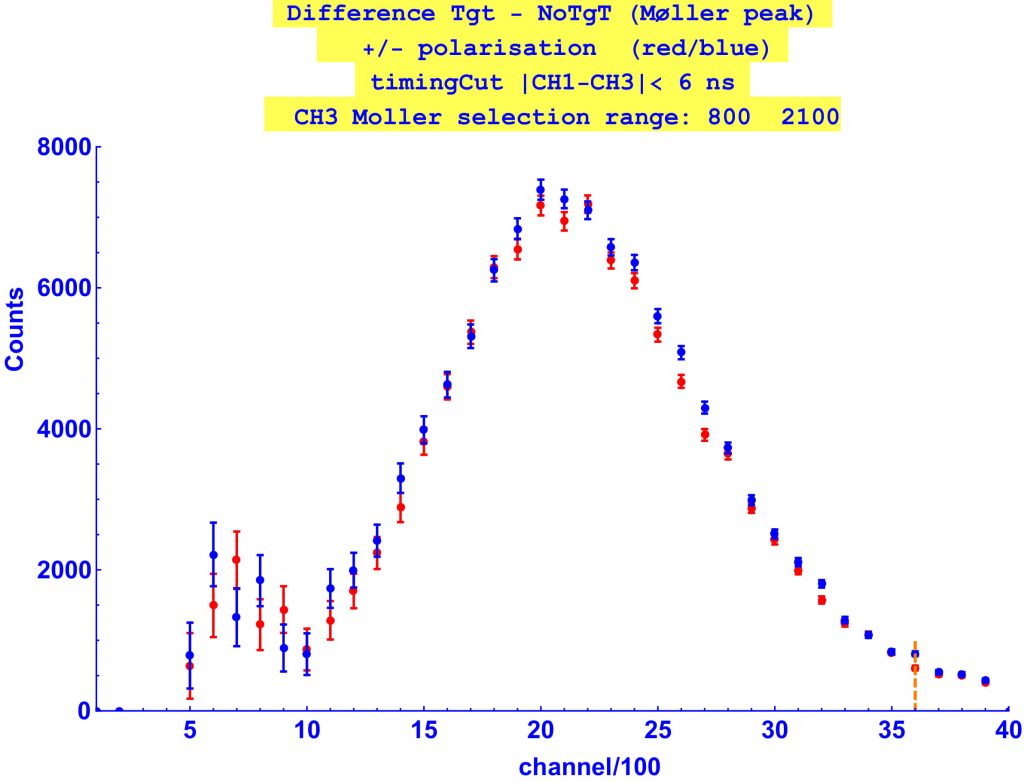
We see that we recover the Møller peak for both beam polarisations, spin- up and down. It can be seen even by eye that there is an asymmetry for these spin configurations since the red points tend to lie below the blue points in the peak. Recall that both datasets correspond to the same duration of data acquisition.
The quantitative result for asymmetry can be obtained ex definitione after counting the „red” and „blue” events in the Møller peak. One obtains a preliminary result in the range:
A = – (0.017 ÷ 0.020) ±0.002±0.002
where the first is the statistical uncertainty and the second systematic (detailed analysis in progress). This value can be confronted with a theoretical prediction of A= -0.018.
It was mentioned above that the coincidence timing was imposed to obtain the above result and it boils down to accepting signals in CH1 and CH3 counters which were separated by less than 6 ns. The corresponding plot for timing, obtained in the same way as the above for amplitudes (subtracting target and no-target spectra) is shown below, justifying this cut,
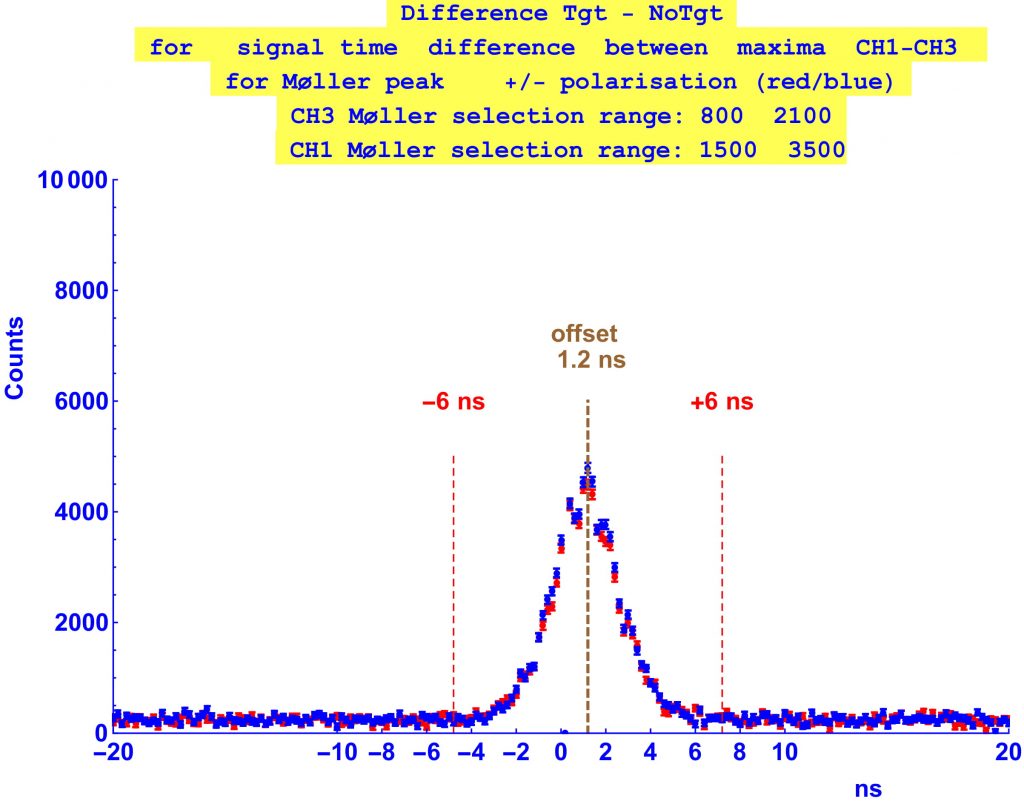
This plot can also serve to determine the asymmetry and preliminarily yields the result in the same range as for the amplitude method.
The above preliminary results indicate that the Mott polarimeter may be a useful tool (as a concept) for a future measurement of spin correlations (which is far more difficult due to large background and infriquent physics events).